
How to submit localized image annotations to the FathomNet Database
- FathomNet

- Jan 1, 2025
- 4 min read
Updated: Aug 7, 2025
Phase 1 — Prepare your images and localized annotations
Step 1 — Request write permissions
Sign up for an account on database.fathomnet.org. Click ‘Sign In’ in the upper right corner. Contact FathomNet’s admin at fathomnet@mbari.org (with the subject line: FathomNet write access) and we’ll give your account write access. Once completed, you’ll be able to upload your curated data to FathomNet.
Step 2 — Make your images publicly accessible
FathomNet expects that your images are hosted on a public web server. Alternatively, you can upload your images via hosting on NOAA’s National Centers for Environmental Information (NCEI). For more information on how to do so, see here.
Step 3 — Add localizations using your favorite annotation tool
There are a number of tools that are popular in the marine science community for annotating images and/or video. Keep in mind that FathomNet uses rectangular localizations, also called bounding boxes, that define a region of interest for an annotation. If you are defining other types of regions of interest (ROI), such as points, free-form polygons, or pixel masks, those will need to be converted to rectangular ROI’s when submitting your data to FathomNet.
Step 4 — Format your localizations as a CSV file
Below is an example comma-separated value, or CSV, file showing the minimum required columns. Note that column order and case are not important:
concept,image,x,y,width,height
Nanomia bijuga,http://dsg.mbari.org/path/image.png,10,20,30,40
Rock,http://dsg.mbari.org/path/image.png,21,22,23,24
The minimum required columns in your CSV file are the following:
concept (or class, or name) — The name of the localized object. We recommend using scientific names where possible.
url (or image) — The URL of the image
x — The x coordinate of the your bounding box in pixels
y — The y coordinate of the your bounding box in pixels
width — The width of the bounding box in pixels
height — The height of the bounding box in pixels
FathomNet expects localizations to use this image coordinate system.

Optional Columns
The following are optional column names:
altitude (or altitudemeters, altitude_meters)— The altitude, in meters, above the seafloor where the images was taken.
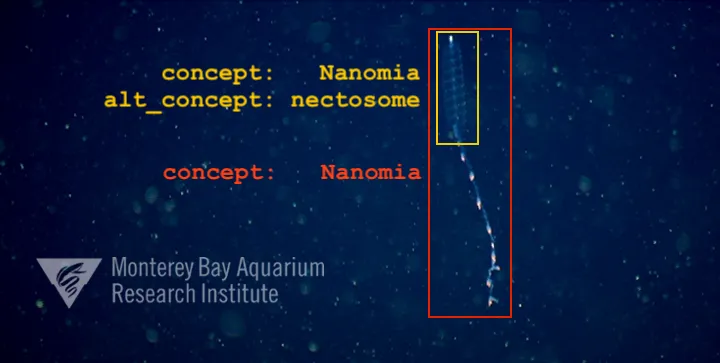
altconcept (or alt_concept, concept2, class2, name2) — A secondary name for the localization. At MBARI, we commonly use this when we have localized a part of the animal. For example, the concept might be Nanomia and the altconcept could be nectosome.
depth (or depthmeters, depth_meters) — The depth, in meters, below the surface where the image was taken.
groupof (or group_of) — Indicates that the box spans a group of objects (e.g., a school of fish or a cloud of krill). Values can be “true” or “false”.
imagingtype (or imaging_type) — For specialized imaging systems, identifies the type of image system used. e.g. dark field microscopy, black and white, low light imaging, etc.
latitude — Latitude, in decimal degrees, where the image was taken. We use the convention of latitude between -90S to 90N.
longitude — Longitude, in decimal degrees, where the image was taken. We use the convention of latitude between -180W to 180E.
observer — The name or identifier for the person or program that created the localization
occluded — Indicates that the object is occluded by another object in the image. Values can be “true” or “false”.
oxygen (or oxygenmll, oxygen_ml_l, o2) — The oxygen concentration, in milliliters per liter, at the time and place where the image was taken.
pressure (or pressuredbar, pressure_dbar) — The pressure, in dbar, at the time and place where the image was taken.
salinity — The salinity at the time and place where the image was taken.
temperature (or temperaturecelsius, temperature_celsius) — The ocean temperature, in degrees Celsius, at the time and place where the image was taken.
timestamp — The time when the image was taken in an ISO 8601 format. Acceptable formats include:

Acceptable date formats truncated — Indicates that the object extends beyond the boundary of the image. Values can be “true” or “false”.
userdefinedkey (or user_defined_key) — An identifier, of up to 56 characters, that can be used to link an annotation back to the original data source. For example, this could be a database key that identifies the annotation in the owning institution’s database. Be aware that these keys are not required to be unique. To avoid key collisions, it’s best to use data types like UUIDs.
Additional Columns
If any additional columns are in your CSV file, they will be added as key-value tags to the image. This may be useful if you wish to include additional environmental information or camera parameters.
Phase 2 — Upload your localized annotations
Step 1 — Sign in to FathomNet using a Google account

Step 2 — Navigate to your collections page


Step 3 — Click the ‘Add collection’ button

Step 4 — Fill out the required DarwinCore metadata

There’s also optional DarwinCore fields available as you scroll down the page. A brief description to each field, as well as a link to the DarwinCore documentation, is provided in FathomNet.
Step 5 — Upload your CSV file
Once you’ve filled out your metadata, scroll down to the very bottom of the page. Clicking on the File input field will allow you to browse to your CSV file. Then click submit.

Phase 3 — Viewing your collection
When your data is submitted to FathomNet, it’s parsed and registered with our data systems. This can take some time depending on the size of the data set you’ve submitted, so be patient. Usually, it’s a couple of minutes per thousand of annotations submitted.


From your collections page, you can click on your newly uploaded collection to view your localizations and metadata.

Add a comment below or email fathomnet@mbari.org if you have any questions!


Open, standardized datasets like FathomNet are invaluable for marine science and AI. Looking ahead, what should be the highest priority: expanding the number of annotated species, improving annotation quality through expert review, or making the submission process even easier for new contributors?
<a href="https://bif.telkomuniversity.ac.id/database-definisi-pengertian-manfaat-jenis-dan-contohnya/ ">bif</a>